WordPress profiling with Sail CLI
A profiler is a set of special software tools and modules, that can measure the execution time, memory usage and other metrics, of your code. These metrics will help you figure out where the application is being too slow, or consuming too much memory.
Sail ships with a lightweight hierarchical profiler based on xhprof. It can be triggered on-demand to generate profile data. The profile data can then be navigated using the built-in interactive Sail profile browser.
The metrics:
Countrepresents the total number of times a specific function was callediWTis the inclusive wall time of a function, i.e. the total time taken while executing code within the function itself, as well as any code within all child functionseWTis the exclusive wall time, that's the time taken while executing code directly within the function, but not code within its child functions.iMemis the inclusive memory usage, i.e. memory used by the function, as well as all child functions combined.eMemis the exclusive memory usage, that's memory used by the function, but not any of its children.
When trying to solve slowness issues, our general recommendation is to look at the inclusive wall time (iWT), then start digging deeper into each child function, which has the significant portion of that time, stepping further in as needed.
If you're dealing with large memory usage, you can use a similar technique, only sort by inclusive memory usage (iMem).
Profiling command reference
Here's a full list of the profiling-related commands:
sail profile run- run the profiler on a URL, download and open the resultssail profile open- open the profile browser with the specified JSON filesail profile curl- wrapper for the curl command more infosail profile download- download a profile JSON from the production serversail profile key- show the profiling secret key
A couple of shortcuts for convenience:
sail profile https://example.orgwill invokerunsail profile path/to/profile.jsonwill invokeopen
Create your first profile with Sail
The simplest way to generate profiling data in a Sail project, is to simply run:
sail profile https://example.org
This will perform an HTTP request to your site, generate profiling data along the way, then download the data to your local working copy, and launch the profile browser.
The profile JSON file will be saved in your .profiles directory, and can be
revisited at any time, using the following command:
sail profile .profiles/filename.json
Note that profiles, depending on their complexity, could take up a significant
amount of disk space, to make sure you clean your .profiles directory every
once in a while.
Note: If you're looking to run the profiler on more complex requests, with custom headers, POST data, etc., read our profiling with cURL section.
Working with the profile browser
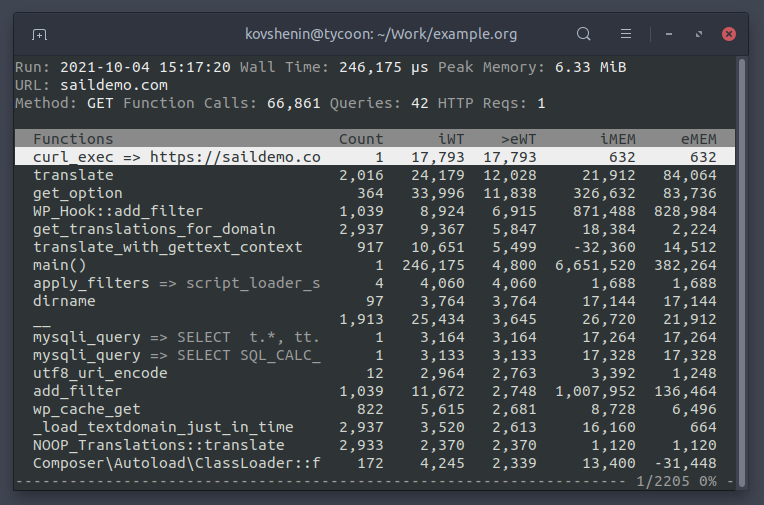
The Sail CLI profile browser allows you to view a profile's summary, all the hierarchy of function calls, as well as step inside these functions to inspect their child and parent functions.
The summary at the top of the profile browser will show:
- Run: the timestamp of the when the profiling data was generated
- Wall Time: the total wall time in microseconds (1,000,000 µs = 1 second)
- Peak Memory: the peak memory usage during the request in mebibytes (1 MiB = 1024*1024 bytes). Note that the iMem and eMem columns are shown in bytes.
- URL: The URL that has been requested during the profiler run
- Method: The HTTP method used for the request
- Function Calls: The total number of function calls
- Queries: The total number of calls to
mysqli_query()and equivalents - HTTP Reqs: The total number of calls to
curl_exec()and equivalents
Navigation
Use the up and down arrow keys to navigate the list of of functions. Use the
page up and page down keys to scroll pages. Use the home and end keys
to quickly jump to the first and last function in the list.
Use the left and right keys to change the sort column. The < and > keys
will also work.
Press enter to step inside the selected function and view its parent and
children functions. Press backspace to go back a step. Press the esc key
to return to the main list of functions.
Press the q key to exit the profile browser.
Profiling WordPress actions and filters
Note that calls to the WordPress core functions do_action and apply_filters
will not be grouped. Instead, they will be split by the action and filter name
respectively, for example do_action => init for the init action in WordPress.
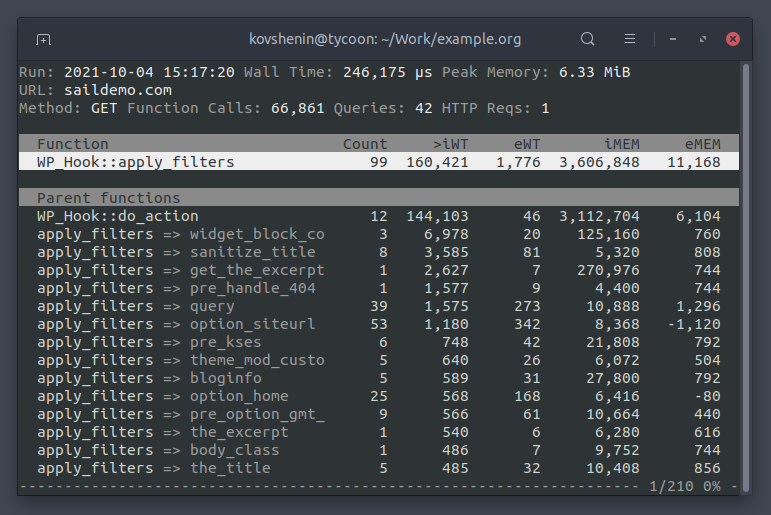
This helps quickly identify bottlenecks inside the WordPress event system, and effectively navigate the hierarchy of actions and filters.